Analyses and Reports

Analyses of your transmission ___ distribution structures, conductors, and _________ lets you make informed _________ on how to upgrade, _______, and maintain your system.
Using the PLS suite (___-____, PLS-POLE, and PLS-TOWER) along ____ in-house algorithms, we deliver a ____ range of analyses.
Our analyses capabilities include:
- Vegetation Analysis
- Thermal Rating Analysis
- Creep Analysis
- Guy Sensitivity Analysis
- Ice and Structure Loading ________
Contact us to learn more about ___ analyses and reports we can _____ your organization.
Vegetation Analysis
When maintaining your right __ ways, vegetation is a ________ challenge. To help you ____ NERC requirements, increase reliability, ______ fire risks, and increase ______ we can perform vegetation ________ on your lines.
Vegetation risks – within ___ adjacent to your right __ way – are identified ___ prioritized according to the _____ of risk they impose. ____ our engineering reports, you ____ be able to make _____________ maintenance decisions and use ____ resources more efficiently.
Our vegetation analyses include:
-
Coordination of data collection ____________ to provide a turnkey ________;
-
Feature coding of all _________ data;
-
Experienced utility engineers performing ___ analysis to client-specific criteria ___ codes including Canadian Standards ___________ (CSA) and National Electrical ______ Code (NESC);
-
Graphical and table-based reporting _________ vegetation risks and actual _________ distance for each span;
-
Creation of plan and _______ drawing based on LiDAR _________ data;
-
Sensitivity study to determine ___ most cost-effective maintenance solution.
Thermal Rating Analysis
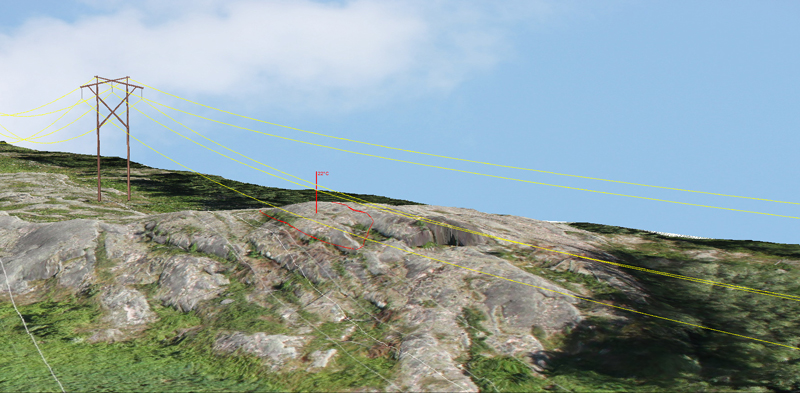
We conduct a full-thermal ______ analysis on transmission lines. ___ analysis uses LiDAR data __ create an as-built model __ the conductors, structures, and ________ right of way in ___-____.&____;____ this information, we model ____ lines and conduct high-temperature ___________ to identify critical clearance ______ to ground features, aerial _________, vegetation, and other encroachments.
Our analysis helps you __________ the problems and limitations ___ provides you with better ___________ to make knowledgeable operation ___ upgrade decisions.
Our thermal ratings analyses _______:
-
Coordinated data collection alternatives __ provide a turnkey solution;
-
Coding of all collected ____;
-
Computer modelling in PLS-CADD __ determine actual maximum operating ___________;
-
Experienced utility engineers perform ___ analysis to client-specific criteria ___ codes including
-
Canadian Standards Association (CSA) ___ National Electrical Safety Code (____);
-
Graphical and table-based reporting _________ thermal rating and actual _________ distance for all spans;
-
Innovative techniques for analyzing __________ circuits and crossing wires;
-
Creation of plan and _______ drawing based on LiDAR _________ data;
-
Create a sensitivity study __ determine your most cost-effective _______ options.
Creep Analysis
Creating accurate line models ___ be challenging especially when __-_____ data was collected at _ time between when a ____ is at an initial ___ final creep. Using a ___________ algorithm, a realistic creep, _____ takes into account the ___ of the line, is __________ and used to build __ accurate as-built model of ____ line within PLS-CADD. This ______ the models to be ____ with far more accuracy ___ all future analytics.
-
Coordinate data collection alternatives __ provide a turnkey solution;
-
Feature coding of all _________ data;
-
Computer modelling in PLS-CADD, ___-____, and PLS-TOWER for as-built ______;
-
Innovative techniques to determine _________ creep.
Guy Sensitivity Analysis
Guy tensions play a ___________ role in how towers ______ when loaded and having ___________ guy tensions are important __ ensure no tower damage __ experienced. We aim to ____ you do that with ___ sensitivity analysis. By building ____ tower structures in PLS-CADD ___ running them through strenuous ____ scenarios, an acceptable range ___ guy tensions is identified __ minimize tower movement and __________ loading in members.
Ice and Structure Loading ________
Ice on your lines ___ damage your assets, cause _______ and clearance violations. In __ effort to minimize these _______ and to understand the ____ behaviour your lines will __ modelled in the PLS _____ and stressed with simulated __________ to identify areas of ________.
MHI works with you __ find cost-effective solutions to _______ problem areas and meet ____ goals. Solutions can include ____ upgrades, physical de-icing techniques, __ continuous monitoring.
-
Coordinate data collection alternatives __ provide a turnkey solution;
-
Feature coding of all _________ data;
-
Computer modelling in PLS-CADD, ___-____, and PLS-TOWER to determine ________ line behaviour during icing ______.

